Special Report: New product development making manufacturers invest
Candy Industry's Ingredient & Equipment Trends survey reveals increased activity in new product launches, equipment investments.
When it comes to sure bets, economic forecasting probably vies with horse-race handicapping regarding predictability, although it tends to be much more complex and certainly a lot less fun.
That’s probably why 19th century Victorian historians dubbed economics the “dismal science.” Unlike the “gay science” of the time, which applied to song and verse writing, economists —most notably Thomas Maltus who calculated that the human race was doomed since it would not be able to feed itself — painted grim pictures of supply and demand.
The dismal science has, of course, evolved, as has song and verse writing. Some would argue that the latter is a bit more dismal today than the latest economic forecasts. The truth might likely lie somewhere in between, with enough dismalness to share among both.
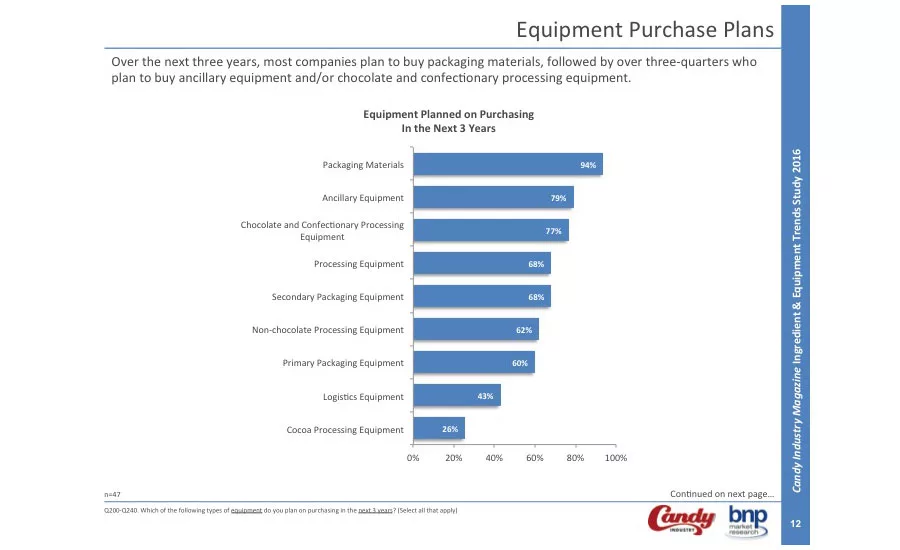
But there’s nothing dismal about Candy Industry’s Confectionery Equipment & Ingredient Survey. Respondents representing a broad cross-section of the industry are looking to make equipment purchases during the next three years.
Three-quarters of those polled indicated that they would purchase ancillary and/or processing equipment within the next three years. Four out of 10 indicated they were going to purchase mixers, while one quarter of the companies queried have set aside budgets for cocoa processing equipment.
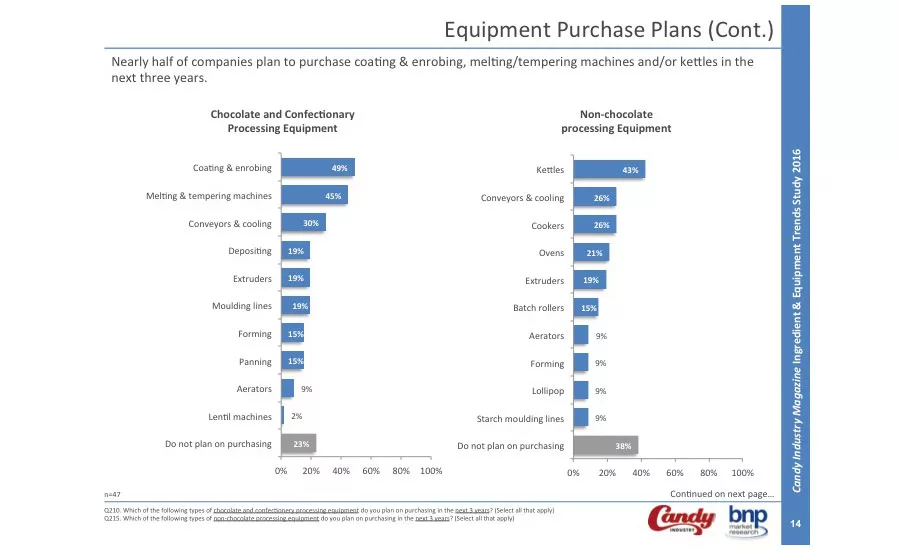
When segregating chocolate and non-chocolate processing equipment, nearly half reported they will invest in coating and enrobing equipment. Melting and tempering machines came in a close second, with 45 percent looking to bankroll that investment. Conveyors and cooling equipment came in third, with 30 percent of those surveyed seeing that as a must-buy.
On the non-chocolate side, kettles emerged as the No. 1 priority, with 43 percent of the companies polled putting them on their wish list. Conveyors and cooling equipment tied with cookers for second place on the non-chocolate equipment purchasing list, each getting 26 percent. Ovens came in third at 21 percent.
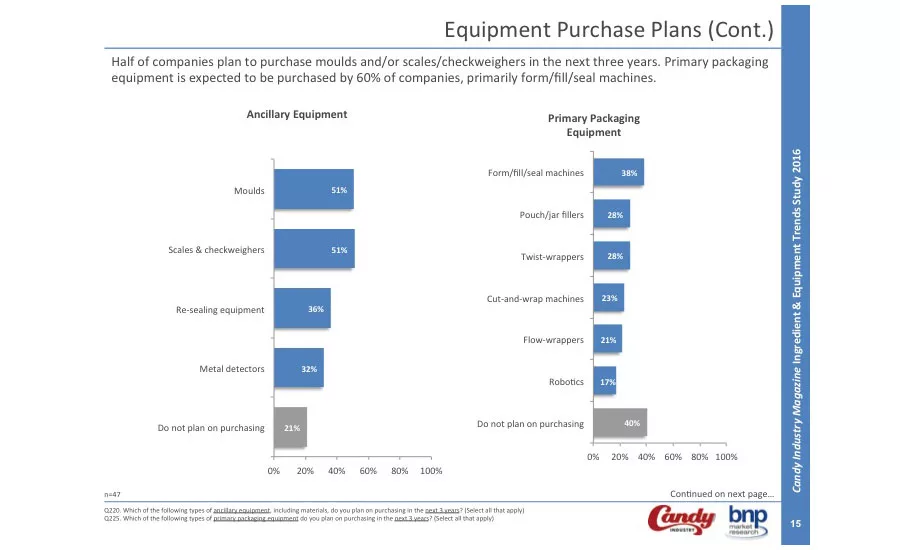
When it comes to ancillary equipment, moulds and scaling equipment/checkweighers headed up the list, with more than half of those responding (51 percent) checking them off on the questionnaire.
Packaging, of course, remains one of the most critical components in manufacturing as reflected by the survey results: Nearly two-thirds (60 percent) acknowledged that they will be shopping for packaging equipment, with form/fill/seal baggers topping the list (38 percent).
When it comes to secondary packaging, labelers top the list with 53 percent, followed by shrink wrappers and carton erectors. On the packaging materials side, as expected, boxes, bags and films comprised the top three; 81, 74 and 68 percent, respectively.
With all the focus on processing and packaging equipment, logistics had to settle for what was left in the budget; warehouse and order fulfillment constituting the largest share (26 percent) for such support.
So how do these purchasing trends compare with last year? Well, according to the survey, half of all respondents indicated they were increasing their spending on packaging equipment and more than one third (39 percent) indicted the same for processing equipment. Even logistical investments were projected to grow by 29 percent.
Equipment investments in 2015 represented 27 percent of the respondents’ capital expenditure budgets. Within that group, more than half reported that they would increase their equipment spending in 2016.
As for what kinds of attributes confectionery manufacturers were looking for in making equipment purchases, no surprises here. Cost savings/efficiency ranked highest with 85 percent; warranty a close second with 81 percent; and the equipment manufacturer’s or distributor’s reputation a not-so-distant third with 77 percent.
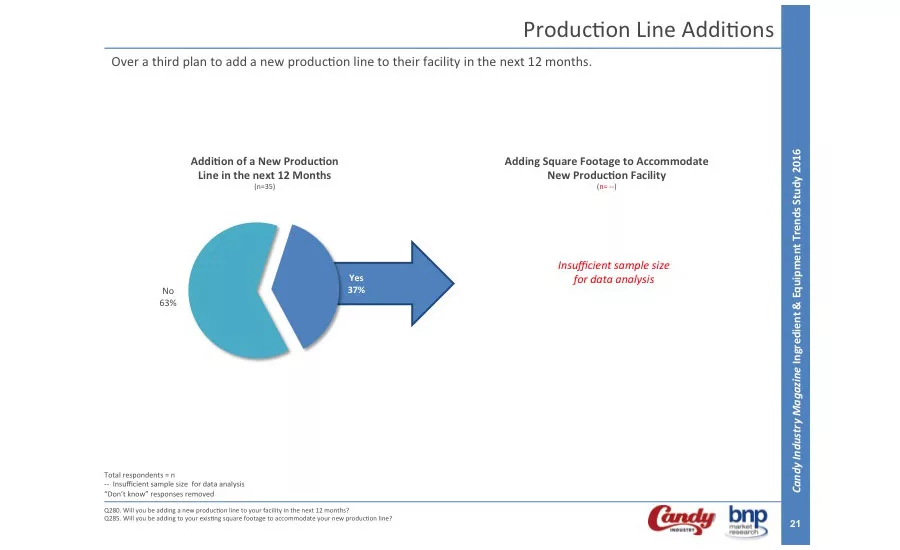
One of the reasons driving this surge in equipment buying stems from manufacturers expanding their production. More than one-third (37 percent) announced that they were adding a new production line within the next 12 months.
On the ingredient side, there were fewer individuals involved in making the purchasing decision (2.8) versus equipment (6), no doubt related to the complexity and cost of the latter versus the former.
Availability, not a shocker to say the least, was rated as the attribute most important to buyers (81 percent), followed by cost savings/efficiency (74 percent) and the reputation of manufacturer or distributor (70 percent). Use in current products (70 percent) played a significant role, suggesting that manufacturers rely heavily on tried and true formulations.
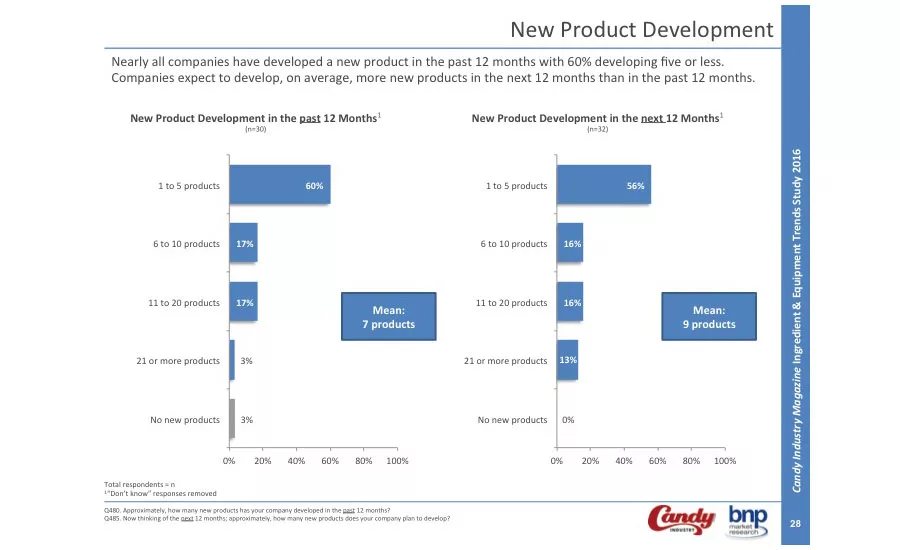
New product development also plays a critical role in the purchase of ingredients these days, as revealed by the survey. Nearly all companies have developed a new product in the past 12 months, with nearly two-thirds of those polled (60 percent) having launched five items or fewer. More than a third will roll out between 6 to 20 new products. The actual mean for all surveyed: seven products.
Expect more next year. Results show that the mean will jump to nine new confectionery items in 2017. There will be a 10 percent increase among companies launching 21 or more products next year.
Given those results, three-quarters of those responding indicated that their ingredient spending would increase in 2016. And those same companies indicated that, on average, 43 percent of their capital budget expenditures involved ingredient purchases last year.
As expected, almost three-quarters (74 percent) of those purchases involved ingredients for existing products. At the same time, two-thirds (66 percent) acknowledged that they were purchasing new ingredients for use in new products.
When reviewing the types of ingredients purchased, there weren’t many surprises. When scrutinizing the data a bit closer, some additional surprises emerged. First, the same percentage of companies — 66 percent — purchase milk and dark chocolate, an indicator of dark chocolate’s recent popularity.
Upon magnifying the results among the healthy/nutritional ingredient purchases, nuts and fruits ranked high, 81 and 64 percent respectively. Seeds and grains, however, are beginning to show up more and more in formulations, as their 26 and 23 percent respective totals suggest.
And when it comes to colors, while artificial dyes and lakes still dominate (51 percent), natural and exempt colors are coming on strong (43 percent).
That same affinity for natural is seen in the types of flavor ingredients purchased, with natural (68 percent) and vanilla (64 percent) topping essential oils (45 percent), artificial (43 percent), chocolate (40 percent) and fruit/FTNF (36 percent).
On the fats and oils side, coconut and cocoa top the list, 51 and 49 percent, respectively. Among sweeteners, sugar still reigns, with 79 percent opting for the traditional favorite.
Additional ingredient survey observations worth noting:
- On average, 29 percent of respondents include nuts and inclusions in their operations.
- Nearly half (48 percent) expect to increase nuts and inclusions usage in the next 12 months.
- Nearly two-thirds of companies have 25 percent or fewer of their operations dedicated to healthy and functional ingredients.
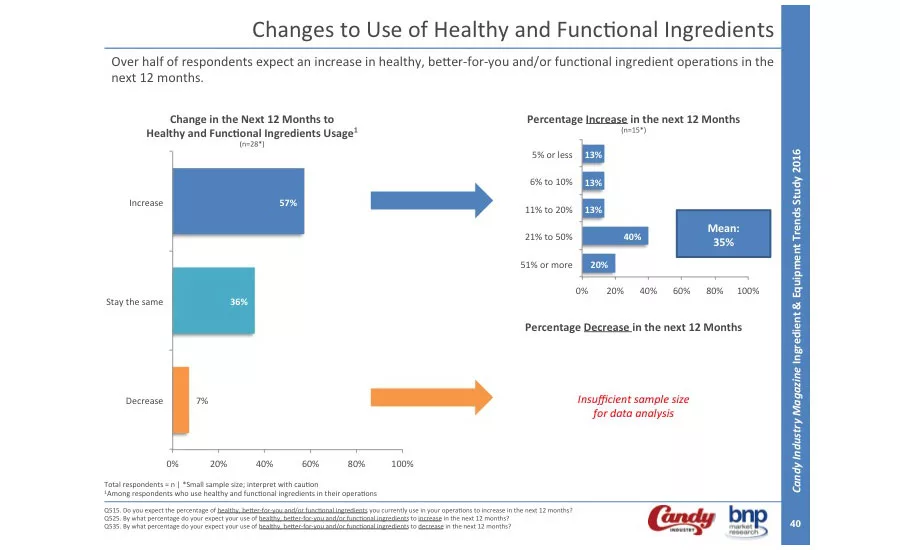
- More than half (57 percent) expect to increase better-for-you/or functional ingredient operations in the next 12 months.
Suppliers take note, 2017 looks to be a demanding year.
Methodology: BNP Media’s Market Research Division, in conjunction with Candy Industry Magazine, conducted an Ingredient and Equipment Trends Study in order to provide detailed information about purchasing decisions. Active, qualified Candy Industry Magazine subscribers were selected from the domestic (United States only) circulation with an e-mail address on file. The survey was conducted between July 21 and August 5, 2016. Three $100 gift cards were used as incentives. Out of 7,959 usable e-mails, 94 surveys were completed, representing a 2 percent response rate.
Looking for a reprint of this article?
From high-res PDFs to custom plaques, order your copy today!


